---
license: apache-2.0
base_model:
- Qwen/Qwen3-Coder-480B-A35B-Instruct
---
Qwen3-Coder-480B-A35B-Instruct Model NVFP4 Quantized
**Qwen3‑Coder‑480B‑A35B‑Instruct Model Comparison Full vs NVFP4**
------
## Test Configuration
| Parameter | Setting |
| ----------------------------- | ----------------------------------- |
| **Full‑Precision Model** | DGX-B300 / 4 GPU |
| **NVFP4 Quantized Model** | DGX-B300 / 4 GPU |
| **Inference Engine** | TRT‑LLM (TensorRT‑LLM) |
| **Tested Concurrency Levels** | 1, 2, 4, 8, 16, 32 |
| **Prompt Length** | ≈ 128 tokens (64 different prompts) |
| **Maximum Response Length** | 128 tokens |
## Performance Metrics Comparison
### 1. Time to First Token (TTFT) – milliseconds
| Full Model | NVFP Model |
| ------------------------------------------------------------ | ------------------------------------------------------------ |
|  |
| 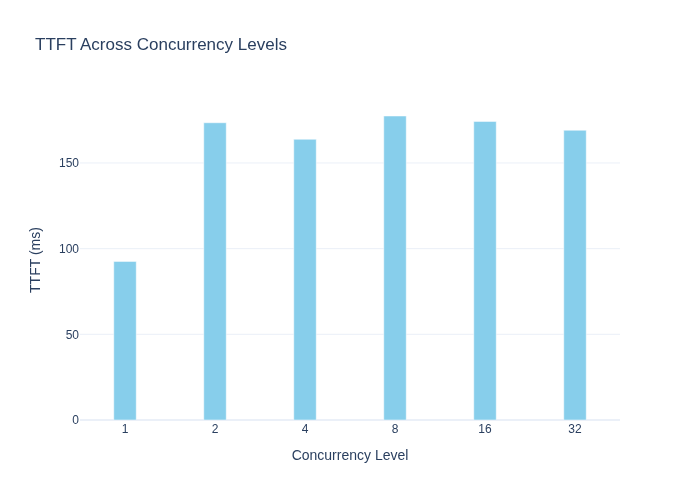 |
| Concurrency | Full Model | NVFP4 Model | Δ (ms) | Performance Loss |
| ----------- | ---------- | ----------- | ------ | ---------------- |
| 1 | 73.46 | 92.56 | +19.10 | +26.0 % |
| 2 | 136.82 | 173.48 | +36.66 | +26.8 % |
| 4 | 130.01 | 163.84 | +33.83 | +26.0 % |
| 8 | 136.87 | 177.42 | +40.55 | +29.6 % |
| 16 | 163.07 | 174.25 | +11.18 | +6.9 % |
| 32 | 134.69 | 169.11 | +34.42 | +25.6 % |
**TTFT Analysis**
- The NVFP4 model shows an average **+26.5 %** higher TTFT across all concurrency levels.
- The greatest performance degradation occurs at concurrency 8 (**+29.6 %**).
- The smallest degradation is at concurrency 16 (**+6.9 %**).
------
### 2. Inter‑Token Latency (ITL) – milliseconds
| Full Model | NVFP Model |
| ------------------------------------------------------------ | ------------------------------------------------------------ |
|
|
| Concurrency | Full Model | NVFP4 Model | Δ (ms) | Performance Loss |
| ----------- | ---------- | ----------- | ------ | ---------------- |
| 1 | 73.46 | 92.56 | +19.10 | +26.0 % |
| 2 | 136.82 | 173.48 | +36.66 | +26.8 % |
| 4 | 130.01 | 163.84 | +33.83 | +26.0 % |
| 8 | 136.87 | 177.42 | +40.55 | +29.6 % |
| 16 | 163.07 | 174.25 | +11.18 | +6.9 % |
| 32 | 134.69 | 169.11 | +34.42 | +25.6 % |
**TTFT Analysis**
- The NVFP4 model shows an average **+26.5 %** higher TTFT across all concurrency levels.
- The greatest performance degradation occurs at concurrency 8 (**+29.6 %**).
- The smallest degradation is at concurrency 16 (**+6.9 %**).
------
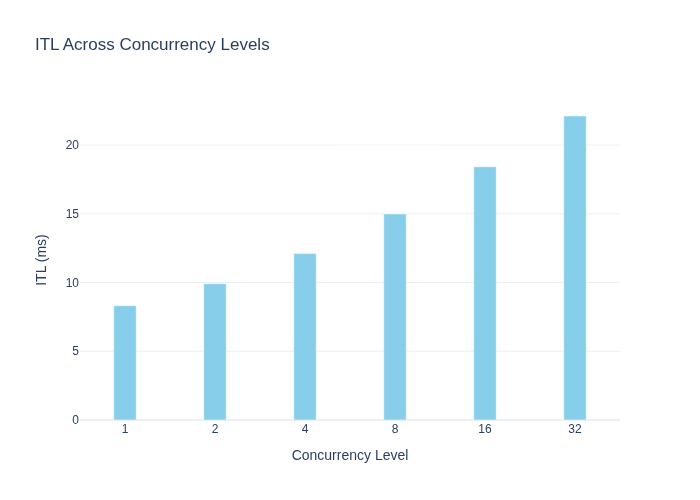
### 2. Inter‑Token Latency (ITL) – milliseconds
| Full Model | NVFP Model |
| ------------------------------------------------------------ | ------------------------------------------------------------ |
|  |
|  |
| Concurrency | Full Model | NVFP4 Model | Δ (ms) | Performance Loss |
| ----------- | ---------- | ----------- | ------ | ---------------- |
| 1 | 8.31 | 8.99 | +0.68 | +8.2 % |
| 2 | 9.92 | 10.01 | +0.09 | +0.9 % |
| 4 | 12.11 | 11.52 | –0.59 | –4.9 % |
| 8 | 14.99 | 13.66 | –1.33 | –8.9 % |
| 16 | 18.42 | 15.68 | –2.74 | –14.9 % |
| 32 | 22.12 | 18.03 | –4.09 | –18.5 % |
**ITL Analysis**
- At low concurrency (1‑2) the NVFP4 model is slightly slower.
- From medium to high concurrency (8‑32) the NVFP4 model **outperforms** the full‑precision model, achieving up to **‑18.5 %** lower latency at concurrency 32.
------
### 3. Tokens Per Second (TPS) – tokens / s
| Full Model | NVFP Model |
| ------------------------------------------------------------ | ------------------------------------------------------------ |
|
|
| Concurrency | Full Model | NVFP4 Model | Δ (ms) | Performance Loss |
| ----------- | ---------- | ----------- | ------ | ---------------- |
| 1 | 8.31 | 8.99 | +0.68 | +8.2 % |
| 2 | 9.92 | 10.01 | +0.09 | +0.9 % |
| 4 | 12.11 | 11.52 | –0.59 | –4.9 % |
| 8 | 14.99 | 13.66 | –1.33 | –8.9 % |
| 16 | 18.42 | 15.68 | –2.74 | –14.9 % |
| 32 | 22.12 | 18.03 | –4.09 | –18.5 % |
**ITL Analysis**
- At low concurrency (1‑2) the NVFP4 model is slightly slower.
- From medium to high concurrency (8‑32) the NVFP4 model **outperforms** the full‑precision model, achieving up to **‑18.5 %** lower latency at concurrency 32.
------
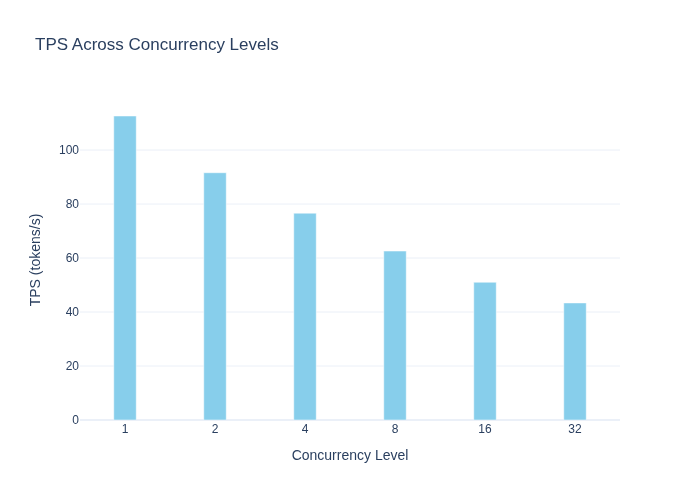
### 3. Tokens Per Second (TPS) – tokens / s
| Full Model | NVFP Model |
| ------------------------------------------------------------ | ------------------------------------------------------------ |
|  |
| 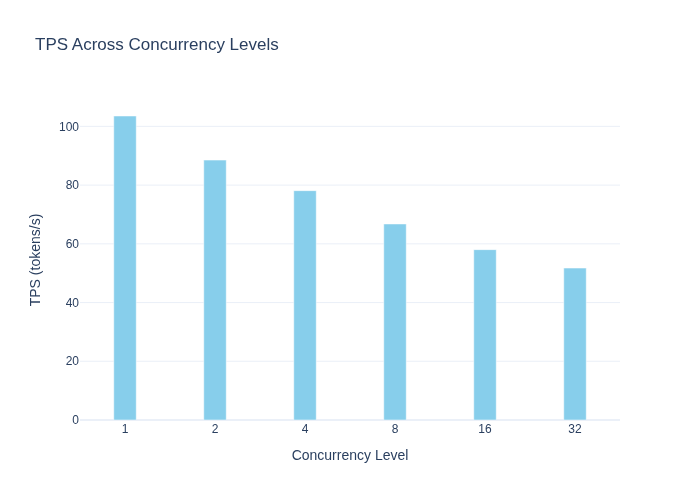 |
| Concurrency | Full Model | NVFP4 Model | Δ (tokens/s) | Performance Change |
| ----------- | ---------- | ----------- | ------------ | ------------------ |
| 1 | 112.61 | 103.54 | –9.07 | –8.1 % |
| 2 | 91.60 | 88.53 | –3.07 | –3.3 % |
| 4 | 76.61 | 78.11 | +1.50 | +2.0 % |
| 8 | 62.58 | 66.77 | +4.19 | +6.7 % |
| 16 | 51.03 | 58.03 | +7.00 | +13.7 % |
| 32 | 43.37 | 51.75 | +8.38 | +19.3 % |
**TPS Analysis**
- The full‑precision model is faster at low concurrency (1‑2).
- From concurrency 4 upward, the NVFP4 model yields higher throughput, reaching **+19.3 %** at concurrency 32.
------
### 4. Total Latency – seconds
| Full Model | NVFP Model |
| ------------------------------------------------------------ | ------------------------------------------------------------ |
|
|
| Concurrency | Full Model | NVFP4 Model | Δ (tokens/s) | Performance Change |
| ----------- | ---------- | ----------- | ------------ | ------------------ |
| 1 | 112.61 | 103.54 | –9.07 | –8.1 % |
| 2 | 91.60 | 88.53 | –3.07 | –3.3 % |
| 4 | 76.61 | 78.11 | +1.50 | +2.0 % |
| 8 | 62.58 | 66.77 | +4.19 | +6.7 % |
| 16 | 51.03 | 58.03 | +7.00 | +13.7 % |
| 32 | 43.37 | 51.75 | +8.38 | +19.3 % |
**TPS Analysis**
- The full‑precision model is faster at low concurrency (1‑2).
- From concurrency 4 upward, the NVFP4 model yields higher throughput, reaching **+19.3 %** at concurrency 32.
------
### 4. Total Latency – seconds
| Full Model | NVFP Model |
| ------------------------------------------------------------ | ------------------------------------------------------------ |
|  |
| 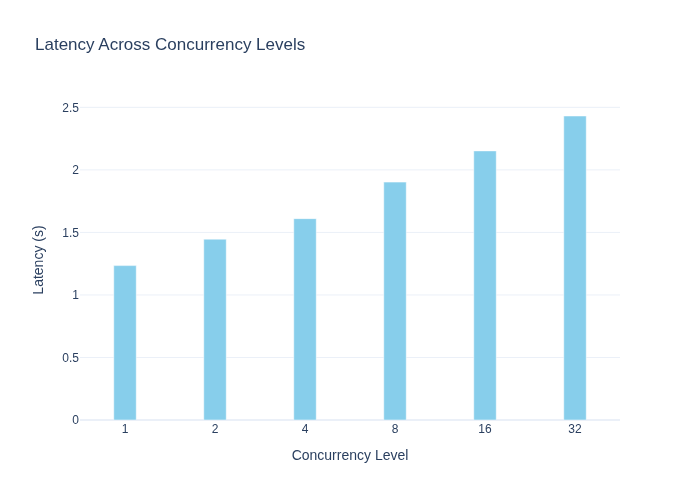 |
| Concurrency | Full Model | NVFP4 Model | Δ (s) | Performance Change |
| ----------- | ---------- | ----------- | ----- | ------------------ |
| 1 | 1.12 | 1.23 | +0.11 | +9.8 % |
| 2 | 1.40 | 1.45 | +0.05 | +3.6 % |
| 4 | 1.66 | 1.61 | –0.05 | –3.0 % |
| 8 | 2.03 | 1.90 | –0.13 | –6.4 % |
| 16 | 2.49 | 2.15 | –0.34 | –13.7 % |
| 32 | 2.94 | 2.43 | –0.51 | –17.3 % |
**Latency Analysis**
- Full‑precision model is better at low concurrency.
- NVFP4 model becomes superior as concurrency increases.
------
### 5. Throughput (RPS) – requests / s
| Full Model | NVFP Model |
| ------------------------------------------------------------ | ------------------------------------------------------------ |
|
|
| Concurrency | Full Model | NVFP4 Model | Δ (s) | Performance Change |
| ----------- | ---------- | ----------- | ----- | ------------------ |
| 1 | 1.12 | 1.23 | +0.11 | +9.8 % |
| 2 | 1.40 | 1.45 | +0.05 | +3.6 % |
| 4 | 1.66 | 1.61 | –0.05 | –3.0 % |
| 8 | 2.03 | 1.90 | –0.13 | –6.4 % |
| 16 | 2.49 | 2.15 | –0.34 | –13.7 % |
| 32 | 2.94 | 2.43 | –0.51 | –17.3 % |
**Latency Analysis**
- Full‑precision model is better at low concurrency.
- NVFP4 model becomes superior as concurrency increases.
------
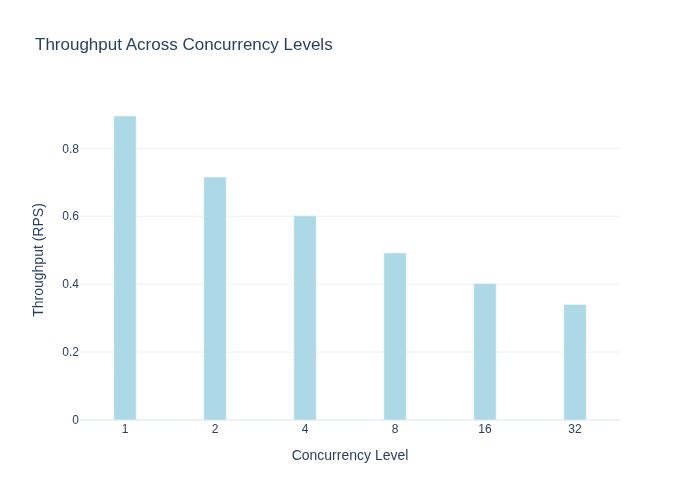
### 5. Throughput (RPS) – requests / s
| Full Model | NVFP Model |
| ------------------------------------------------------------ | ------------------------------------------------------------ |
|  |
| 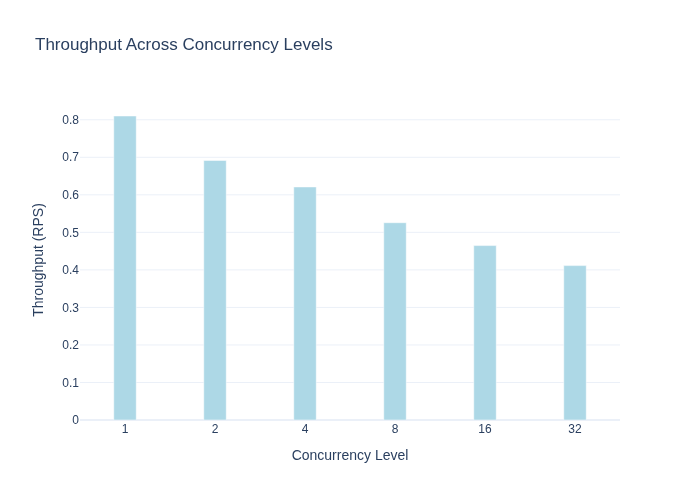 |
| Concurrency | Full Model | NVFP4 Model | Δ (RPS) | Performance Change |
| ----------- | ---------- | ----------- | ------- | ------------------ |
| 1 | 0.90 | 0.81 | –0.09 | –10.0 % |
| 2 | 0.72 | 0.69 | –0.03 | –4.2 % |
| 4 | 0.60 | 0.62 | +0.02 | +3.3 % |
| 8 | 0.49 | 0.53 | +0.04 | +8.2 % |
| 16 | 0.40 | 0.46 | +0.06 | +15.0 % |
| 32 | 0.34 | 0.41 | +0.07 | +20.6 % |
**Throughput Analysis**
- Full‑precision model wins at very low concurrency.
- NVFP4 model surpasses it from concurrency 4 onward, achieving **+20.6 %** at concurrency 32.
|
| Concurrency | Full Model | NVFP4 Model | Δ (RPS) | Performance Change |
| ----------- | ---------- | ----------- | ------- | ------------------ |
| 1 | 0.90 | 0.81 | –0.09 | –10.0 % |
| 2 | 0.72 | 0.69 | –0.03 | –4.2 % |
| 4 | 0.60 | 0.62 | +0.02 | +3.3 % |
| 8 | 0.49 | 0.53 | +0.04 | +8.2 % |
| 16 | 0.40 | 0.46 | +0.06 | +15.0 % |
| 32 | 0.34 | 0.41 | +0.07 | +20.6 % |
**Throughput Analysis**
- Full‑precision model wins at very low concurrency.
- NVFP4 model surpasses it from concurrency 4 onward, achieving **+20.6 %** at concurrency 32.